Info
Overview
The Cop4ESTCoast prototype is designed to estimate the water quality status of the Estonian coastal area by providing daily and monthly statistics on key indicators: Chlorophyll‑a and Transparency. These statistics include minimum, maximum, average, and standard deviation values, derived from Copernicus Marine Services data.
This application is part of the Cop4ESTCoast project, funded by Copernicus Marine National Collaboration Program under agreement nr VLTTO24482 (24262‑COP‑COASTAL & ARCTIC HUBS UPTAKE‑8000).
For inquiries: mirjam.uusoue[at]ut.ee
User Interface
Selecting an area
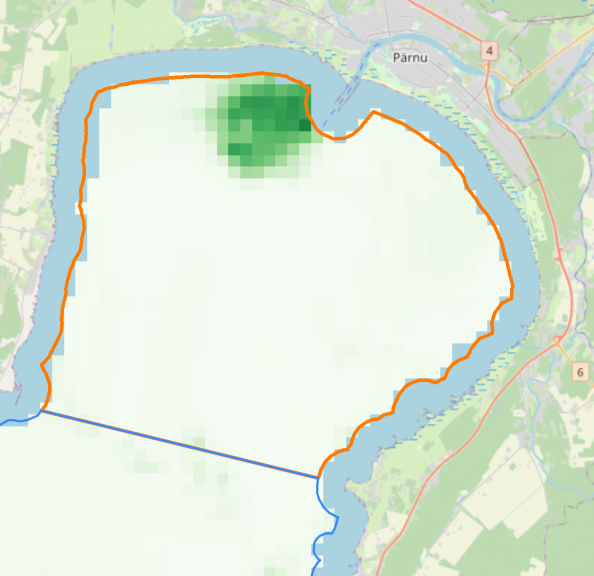
Users can select an area in two ways:
- Click directly on the map to choose a region.
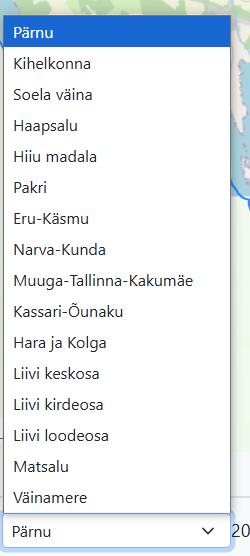
- Use the drop‑down menu in the bottom‑left corner to select from predefined areas.
Once an area is selected, the application displays:
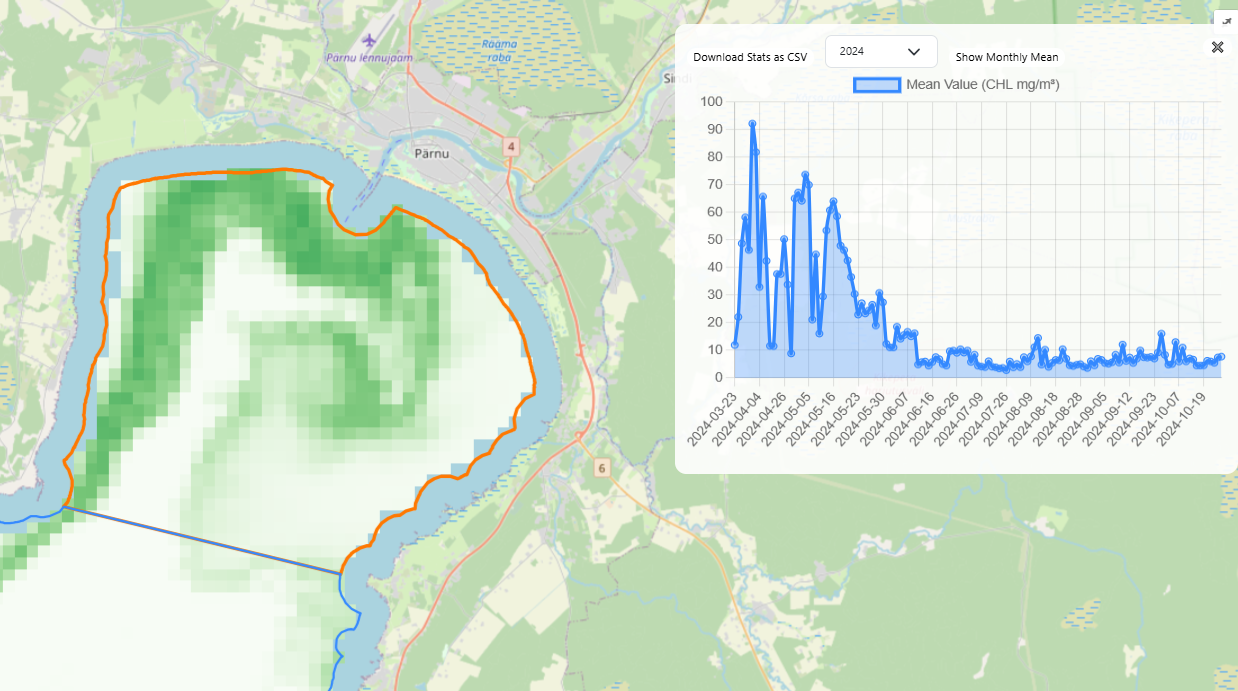
- The average value point on the graph.
- Minimum, maximum, average, and standard deviation values.
- Pixel coverage of the selected variable.
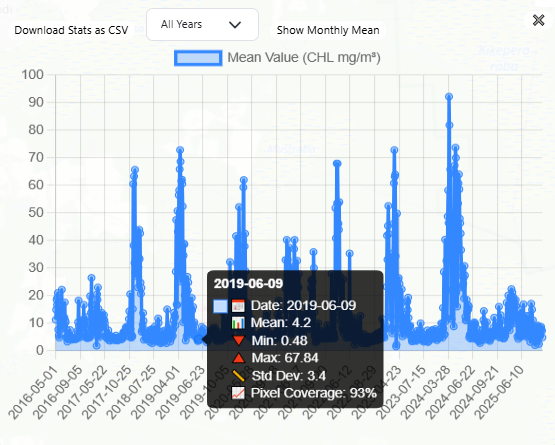
Users can hover over a specific date point on the graph to view the corresponding statistics in text format.
Changing layers
Layers can be adjusted in the bottom panel of the interface.

The following layers are available:
- Chlorophyll‑a
- Transparency
- Phosphate (PO₄)
- Nitrate (NO₃)
These layers provide raster data on the map and average values on the graph.
Example
The image below illustrates Chlorophyll‑a values displayed on the map.
Selecting a time period
Users can view data for:
- All available years
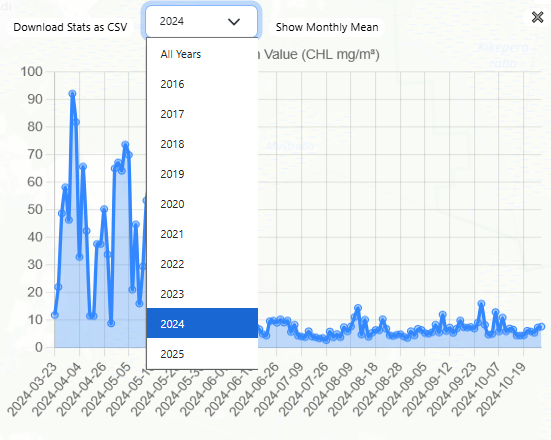
- A specific year, which can be selected from the drop‑down menu on the graph.
How to Select a Specific Date
Click on a point on the graph to display the corresponding statistics.
- The selected statistics will appear in a box on the graph and in the lower section of the page.
- Users can choose to display daily or monthly average values of the selected parameter.

Downloading graph data
To download data:
- Click “Download Stats as CSV” in the left corner of the graph.

- The downloaded dataset depends on the selected time range:
- If a specific year is selected → Data for that year is downloaded.
- If all years are selected → The complete dataset is downloaded.
The downloaded file contents look like this for Chlorophyll‑a:
| Date | Mean | Min | Max | Std Dev | Pixel Fraction (%) |
|---|---|---|---|---|---|
| 23.03.2024 | 11.9 | 4.63 | 74.02 | 10.73 | 64 |
| 26.03.2024 | 22.08 | 5.98 | 104.31 | 16.16 | 88 |
| 27.03.2024 | 48.76 | 0.37 | 124.54 | 19.14 | 56 |
| 28.03.2024 | 58.24 | 0.38 | 124.23 | 22.76 | 95 |
| 30.03.2024 | 46.38 | 0.37 | 116.87 | 24.63 | 64 |
Land cover and land cover change
Users can explore land cover and land-cover change in the river catchments linked to each coastal area.
Zoom in on the map to clearly see the different land-cover colours.
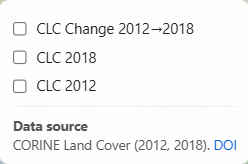
Open the Layers panel  and select one or more of the following:
- CLC 2012
- CLC 2018
- CLC Change 2012–2018
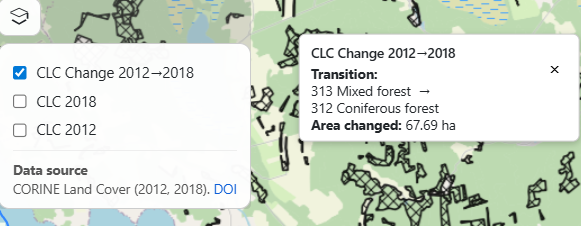
When the CLC Change 2012–2018 layer is active, areas where land cover has changed are shown as black polygons.
Clicking on a polygon opens an information window with:
- The type of transition (from–to land-cover classes)
- The area that has changed
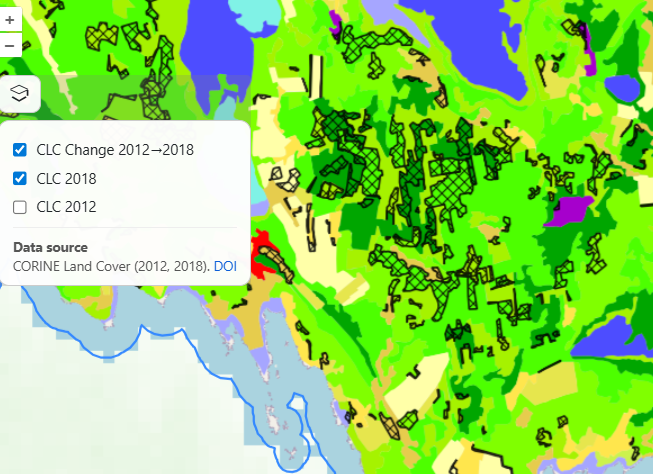
When CLC 2012 or CLC 2018 are selected, the underlying land-cover classes become visible.
The effect of land-cover change inside the marked squares can be examined by turning on CLC Change 2012–2018 and then switching between CLC 2012 and CLC 2018 layers.
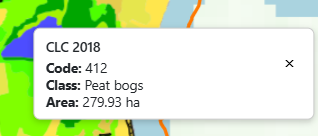
Clicking on a coloured area on the map displays the corresponding land-cover type in the information box.
Water quality classes
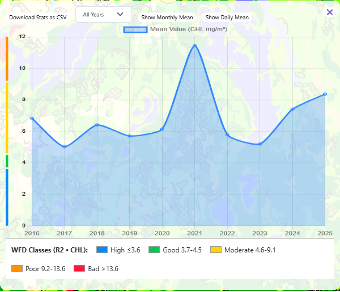
Below the graphs, the application shows the water quality classes for the selected region and parameter (Chlorophyll-a, Transparency, Nitrate, or Phosphate). The example shown is for Chlorophyll-a in Pärnu Bay. The colour-coded legend explains the water quality classes and their limit values, which are shown next to the y-axis of the graph.
Data processing and sources
The following Copernicus Marine Services (CMEMS) products are used in the Cop4ESTCoast application:
Baltic Sea Biogeochemistry Analysis and Forecast
- Phosphate (PO4) concentration (mmol/m3)
- Nitrate (NO3) concentration (mmol/m3)
Baltic Sea Multiyear Ocean Colour Plankton, Reflectances and Transparency L3 daily observations
- Chlorophyll‑a concentration (mg/m3)
- Transparency (Kd490) (m−1)
- Secchi disk depth (SDD) (m) is calculated from Kd490 values using a regional algorithm based on Alikas et al., 2015.
The following Land Cover Services products are used:
CORINE Land Cover 2012 (vector/raster 100 m), Europe, 6-yearly
CORINE Land Cover 2018 (vector/raster 100 m), Europe, 6-yearly